

 Shahrukh Khan
What is a Data Monetization? | Unlock Revenue with Data Portals
Everyone says, "data is the new gold," and there are a few ways to actually create revenue generation using insights. One such method to unlock the...
2021 was a prominent and influential year in the world of Human Resources. The pandemic pushed working professionals to adapt, whether it would be awkwardly scurrying to find the exit button on a zoom call or simply ordering groceries online, the lifestyle changes from the pandemic continue to leave an impact.
However, one noticeable trend continues to be a subject of research: the Bureau of Labor Statistics indicated that 4 million people quit their jobs last February. It begs the question: why did we see a record number of people quitting their jobs last year to pursue other opportunities?
In this blog, I will talk about the importance of HR analytics during what is being deemed as The Great Resignation, how understanding employee turnover can benefit your business, on some practical tips on how to do so.
 Attrition or employee turnover refers to the percentage of employees who leave your company during a specific period. In general, turnovers include resignations, terminations, or retirements but don't include the internal movement of jobs within an organization.
Why is it important to maintain a low rate of turnover from an organizational standpoint? It comes down to three main reasons:
Finding the right talent for your own business is difficult and expensive. It's hard to associate an exact cost for recruiting. The recruiting process consists of expenses related to advertising a job posting and any time spent building that job posting, sorting through potential candidates, and then interviewing them.
Suppose we put a price tag on the cost of attrition. In that case, it can range from anywhere from 30% to almost two times an employee's annual salary, depending on the industry.
This one needs little explanation, when skilled people leave the company, work is often interrupted or stopped until a replacement is found. Even then, it can take a while for your new hire to get back to your prior employee’s level of productivity. It can be months, sometimes years, for that new employee to achieve the same level of productivity as your prior employee.
It's normal to have employees leave the company. However, when you have a high rate of employees leaving within a short period, you ponder "why?", and so does your team and those on the outside looking in.
A high attrition rate is often indicative of a work environment and a company culture that is not sustainable in the long run. With proper analytics, you may be able to link attrition to inadequate work-life balance, poor working conditions, a non-inclusive work environment, etc.
Employees who leave voluntarily due to poor company culture tend not to refer those in their network to their previous workplace. This makes it difficult to recruit talent, which contributes to the cycle of making it more expensive to find new talent and much more expensive to lose existing talent.
So, how do we get ahead of all this? The domain of HR analytics can give us insight into a broad spectrum of potential issues and solutions, whether it's understanding your organization's workforce distribution, gauging diversity/inclusion goals, or forecasting budgets.
To show you what I mean, we've built a Tableau dashboard to demonstrate the value of HR analytics and attrition analytics. The dashboard shown below is an example of how an organization can evolve its HR Analytics, regardless of where they currently fall on Gartner's analytics maturity model (Figure 1).
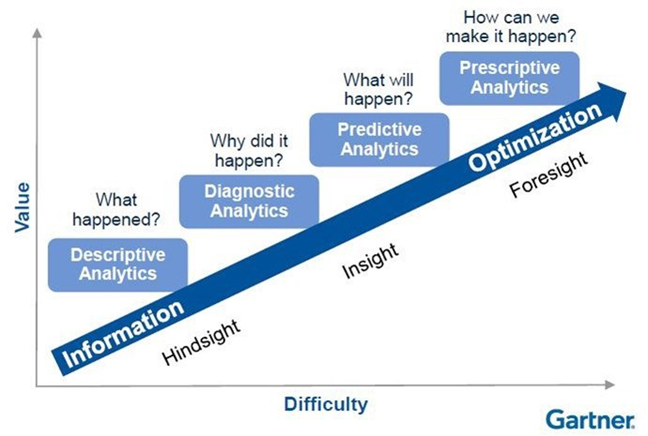
This dashboard was built using this dataset here. With this dashboard, we'll start off with a general overview, followed by an in-depth analysis of attrition.
High turnover presents a number of issues for an organization. Minimizing turnover helps retain experienced talent and positions a business to better attract top talent. This dashboard is intended to help organizations understand their current employee landscape and how they can use their data for actionable insight with regard to attrition. Let’s start at the beginning of the Gartner Analytics Maturity Model…
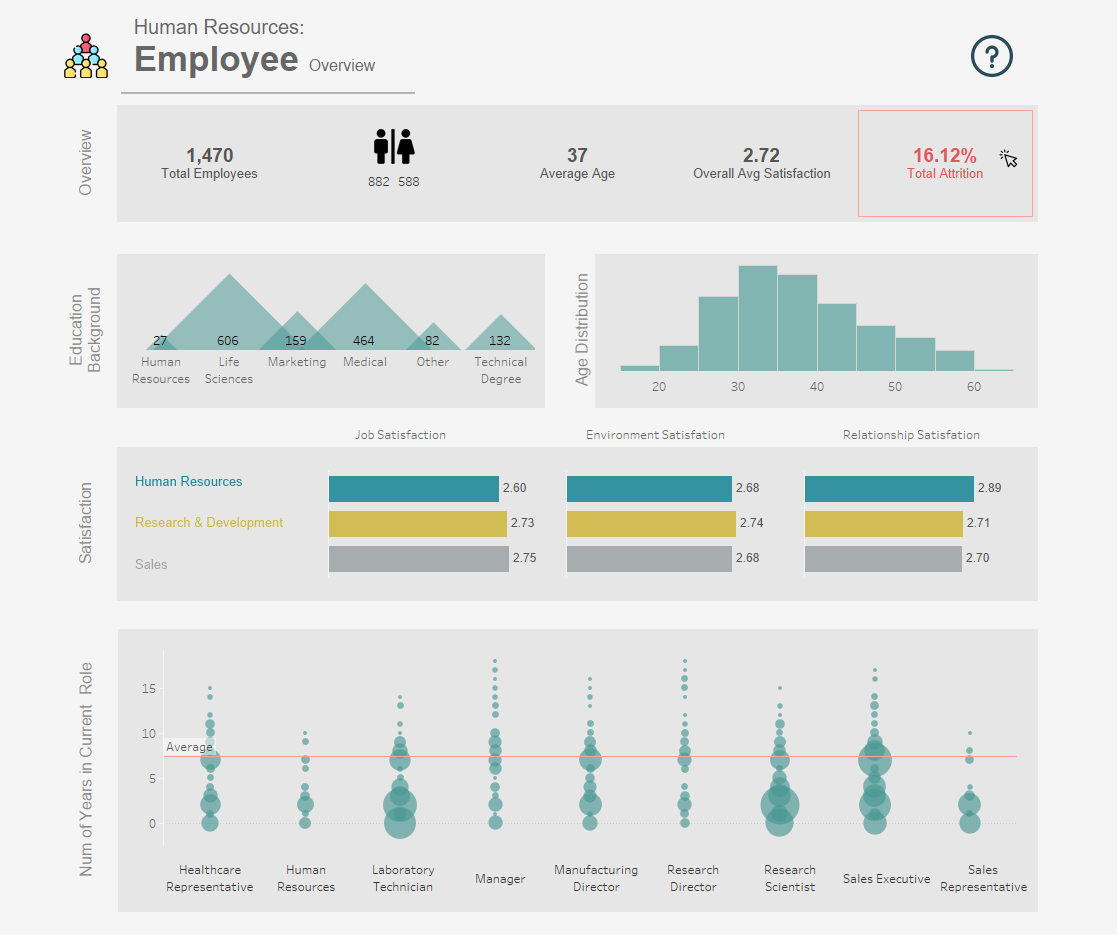
The first page of the dashboard gives us an overview of our organization. Using this page of our dashboards some of the insights we can quickly uncover are:
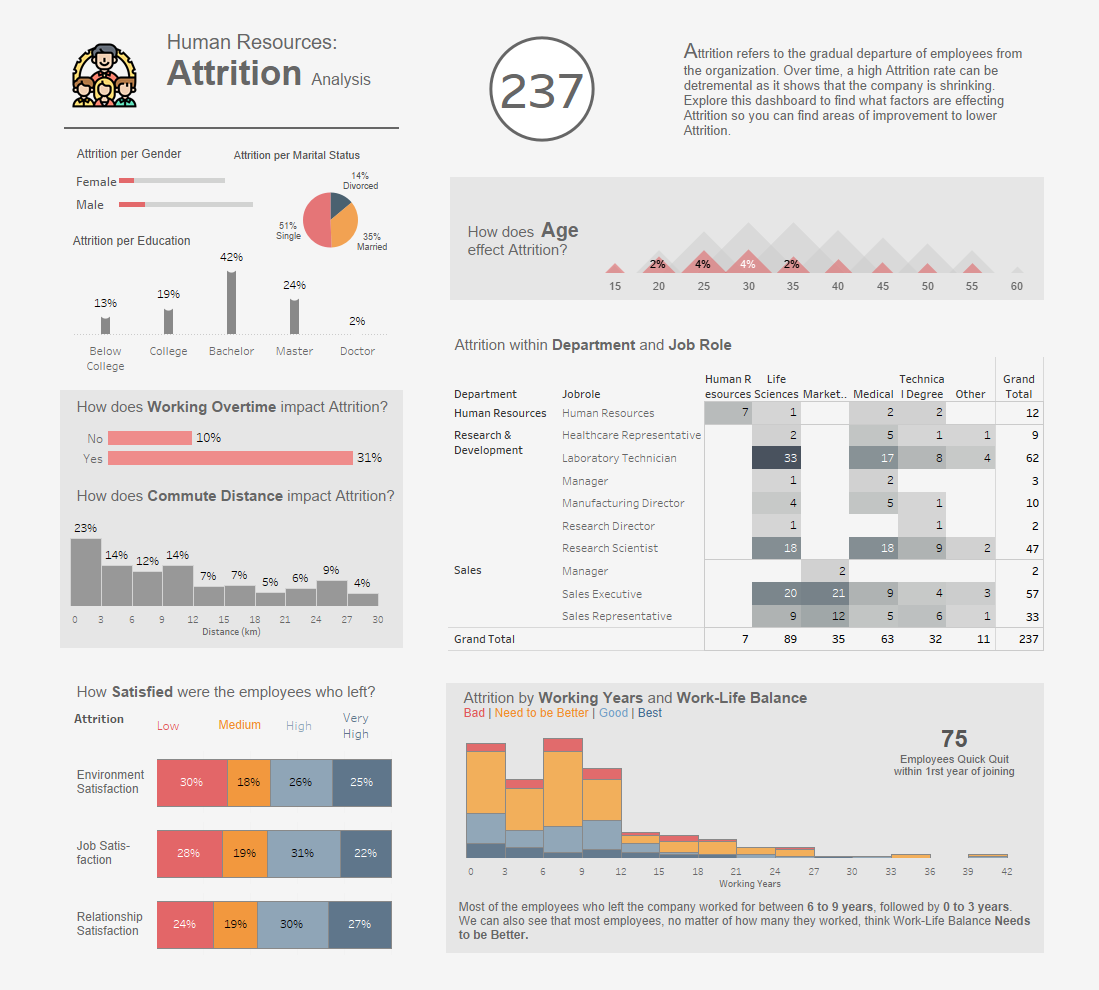
We’ve noticed that our attrition rate is high, and we want to dive in further. Our second page of the dashboard allows us to start diagnosing why that may be. Some insights we can uncover from this view include:
Our third page of the dashboard is an interactive way to showcase our ‘data science’ findings within Tableau. A few highlights from this dashboard are:
This page of the dashboard is intended for data scientists. As a data science professional, I find it a bit of a nuisance to manage and keep track of models and their health. If tableau is a part of our tech-stack, we can build a dashboard that can help us understand, organize and manage our model lifecycles better. With this dashboard we can:
Hopefully, you now have some ideas on how you can apply analytics to your own Human Resources datasets in order to improve employee retention and understand key trends while you still have time to act on them.
Everyone says, "data is the new gold," and there are a few ways to actually create revenue generation using insights. One such method to unlock the...
Technology has revolutionized how businesses operate, with data being at the forefront of this transformation. The ability to analyze data and...
Why Embedded Analytics with Tableau Embedded analytics is a growing use case for organizations looking to deliver (and even monetize) their data...