

 Shahrukh Khan
What is a Data Monetization? | Unlock Revenue with Data Portals
Everyone says, "data is the new gold," and there are a few ways to actually create revenue generation using insights. One such method to unlock the...
In this post, we will learn how to build a basic decision tree using Python. We’ll be going over a Jupyter notebook on how to build a decision tree to predict if a person will be donating blood.
For the sake of simplicity, we will keep data cleaning to a minimum, and we will skip exploratory data analysis. Because this is an introductory guide to decision trees, we will not be exploring feature engineering or model improvement techniques. We will take a look at those methods to improve our model in a future blog!
The dataset we are using can be found in Kaggle here. Our dataset originates from a mobile blood donation vehicle in Taiwan. The Blood Transfusion Service Center drives to different universities and collects blood as part of a blood drive. The objective of building a model is to predict whether or not a donor will give blood the next time the vehicle comes to campus.
Opening the dataset, you will find two main files that we will be working with - "train" and "test" csv files. We will be using the train csv file to build our model. Our train dataset has a column called “Made Donation in March 2007” which is our variable of interest. Our test dataset contains the same data, without the “made donation in March 2007” column.
Let's start by loading our imports. NumbPy and Pandas are standard loads that have a variety of functions for data wrangling. Sklearn is our machine learning import, which houses the majority of the functions we will need to apply predictive analytics. After imports, we'll load the data. I tend to keep a copy of of my original datasets for good measure. After loading our imports and data, we want to make sure that the dimensions are what we expect and take a quick peek at the data.
An important goal for our decision tree learning algorithms is to find the best split for each node of the tree. The measure of goodness of fit can be evaluated in a few ways, one of which is using Information Gain. However, the Sklearn library we're going to use implements Gini Impurity.
Gini Impurity is calculated as the probability of mislabeling a class, assuming that the class is randomly labeled in accordance with the distribution of all remaining classes in our dataset. Our tree algorithm will try to find the split that decreases the Gini Impurity the most across the two resulting nodes. That's how we will know how the splits occur - but what about the depth/complexity of the tree?
To answer this question, we will attempt to optimize the parameter 'max_depth'. This parameter determines the maximum number of features the model is going to use for each prediction.
A good way to find the best value for this parameter is iterating through all the possible depths and measuring the accuracy with a robust method, such as Cross Validation.
Cross Validation is a resampling procedure that can be used to train and evaluate models. K-fold Cross Validation splits your data into k number of folds. Cross Validation allows our model to be trained and tested with all available data across all folds, avoiding any splitting bias.
The general procedure is as follows:
We can then summarize the efficacy of the model using the sample of model evaluation scores.
The code below performs a 10-Fold Cross Validation in order to find the maximum depth of the tree that yields the best training accuracy.
The max_depth parameter seems to perform the best when it is 3 (79.8% average accuracy across the 10 folds). If we increase our max_depth, the model has worse results, probably due to over-fitting. Therefore, we will be using max_depth as 3 to build our model.
We can now build our tree!
And there it is - our Decision Tree! It achieves an accuracy of 79.86% across the training dataset.
To explain the tree diagram, the first line of each node (excluding the final row) is the split condition. It follows the form "feature <= value". For example, we can infer it as - has it been less than 6.5 months since the last donation?
The Gini Impurity of the node is also listed along with "Samples" which are the number of observations contained in the node.
"Value" shows the class distribution of the samples. This would mean it's showing us [No Donate, Donate].
"Class" corresponds to the predominant class of each node, and this is how our model will classify an observation.
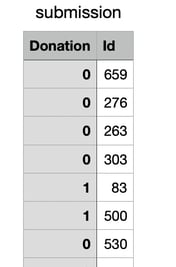
Our "test" dataset results are saved in a separate csv file called "submission". If you open this file, you will see that there are corresponding Id's with 1/0's. The 0's are the people who our model thinks will likely be a donor.
Thanks for reading! There are many ways to improve results from a decision tree - we'll take a look at that in a future blog. If you are looking for the full notebook, it can be found here.

Everyone says, "data is the new gold," and there are a few ways to actually create revenue generation using insights. One such method to unlock the...

Technology has revolutionized how businesses operate, with data being at the forefront of this transformation. The ability to analyze data and...

Why Embedded Analytics with Tableau Embedded analytics is a growing use case for organizations looking to deliver (and even monetize) their data...