

 Luke Komiskey


Tableau Conference 2025 | Know Before You Go
If you’re a data enthusiast, analytics professional, or just someone curious about Tableau’s latest innovations, the Tableau Conference 2025 is your...
By now, TabPy should be installed and connected to your Tableau Desktop v10.1+. This post is focused on the fun part – running Python code directly in Tableau and visualizing outputs!
Python code is inserted using Tableau’s calculated fields so incorporating Python into existing data analysis is straight-forward and familiar for Tableau users. Four functions are available within Tableau Desktop depending on the output of your Python code block.
All four functions follow a similar input format within Tableau’s calculated fields – insert Python code block in quotation marks and then pass in one or more arguments (i.e. fields) from your Tableau data source. I’ll focus on two good examples in this post using Tableau’s provided Superstore data set. For those unfamiliar with the Superstore data, it is customer-level sales data of a fictitious US-based business that sells furniture, office supplies, and technology products. It’s a clean data model that works well to quickly test out Tableau features.
To get a basic understanding of calculation syntax, I built a simple loop in Python to check the sum of profit for each U.S. state and return a Boolean list of whether it was greater than or less than zero. Note that using Python to do this task is overkill as Tableau has a lot more efficient, simpler ways to do this profitability check.
The calculated field starts with SCRIPT_BOOL in this example because I want to return a Python list filled with Boolean types (True or False). The first parameter needed is the actual Python code block – surrounded by quotation marks. My code block creates an empty Python list called ‘newList’ and then loops through each SUM([Profit]) supplied in another list to check if greater than 0.
The text “_arg1” in the Python code block tells Tableau that I will supply the argument (i.e. data field) at the end of my Tableau function. It’s a placeholder essentially. The second parameter of Tableau’s calculated field describes what data to send for _arg1 – in this case, SUM([Profit]). It’s important to understand that these functions only take aggregate inputs. In turn, Tableau is expecting a single column with either one row or as many rows as you passed. The error ‘Invalid JSON’ will often mean that Python’s ‘return’ result doesn’t match the format Tableau is expecting.
As an example, I want to see what profitability looked like in each state.
Tableau first checks the context of the view before passing the SUM([Profit]) list to Python. By adding state, Python receives a list with 49 elements (-2 from Alaska/Hawaii, +1 for D.C.). The beginning of the list in Python looks like [5787, -3428, 4009, 76381, …]. The calculated field loops and build a new list with 49 elements looking like [True, False, True, True, …]. I could easily add in city or zip code-level data and TabPy will recalculate. Being able to change the context of the view with Tableau’s click-and-drag interface is the biggest selling point for using languages like Python or R directly in the tool (discussed more below).
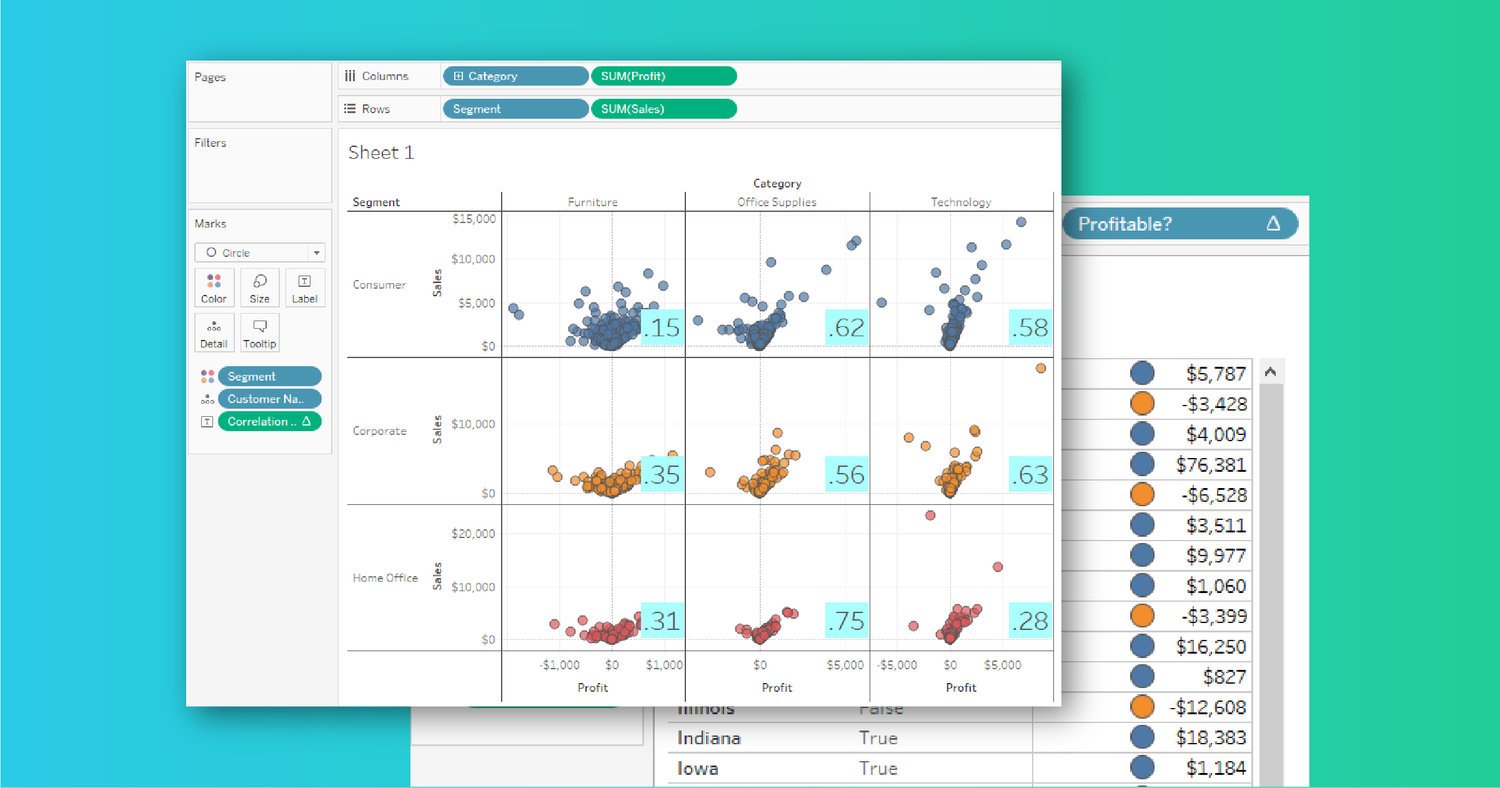
The final example shows off a much more useful scenario for showing off Python in Tableau – correlation coefficients or the linear dependence of two variables. Leveraging an example provided in TabPy’s documentation, calculating the relationship between sales and profits would look like the following:
This calculated field differs from the prior example in that:
Product category and customer segment were used in my final view to create a neat 3×3 grid to individually analyze relationships between sales and profit. Adding customer names to ‘Details’ brings in more granularity so that each circle represents a customer’s purchase in that particular product category. Tableau then uses the context of the view AND the calculated field’s addressing/partitioning to determine the level in which the Python code is run. In this example, product category and customer segment are on the view. The ‘Correlation Coefficient’ calculated field (a.k.a. Python results) can be changed to calculate at the level of customer name.
In this example, TabPy is now called 9 times to calculate the correlation coefficient for the 3×3 matrix in the view at the level of customer. Without changing the default table calculation of including product category, customer segment, and customer name, the displayed coefficient would be for the entire displayed dataset. While not wrong, the above screenshot is a lot more powerful for testing data hypotheses.
TabPy’s release provides a ton of new opportunities to use Python’s powerful libraries directly in Tableau. It’s great to see Tableau continue to provide API support outside of the product. With that said, most organizations I’ve worked with have already been exporting their Python results for visualization in Tableau for awhile. I personally think that pre-processing data through Python scripts outside of Tableau will continue being the norm for a few reasons.
In conclusion, I still believe that TabPy has a great place in the Tableau ecosystem. The ability to change the resulting data from Python based on the view’s context is a huge reason why I’d consider using it for real-time data exploration. I think TabPy is also a great step in promoting data science capabilities within Python and R; organizations are noticing the benefits and making investments in using data as a competitive advantage beyond day-to-day operational reporting. I’m really excited to see where these capabilities go next!
-2.gif)
If you’re a data enthusiast, analytics professional, or just someone curious about Tableau’s latest innovations, the Tableau Conference 2025 is your...

Tableau Plus is the new premium offering from Tableau, a leading data visualization and business intelligence platform. It builds upon the...

If you've spent any time working with Tableau, you've likely encountered the dreaded "Cannot Mix Aggregate and Non-Aggregate Arguments" error. It's a...